Graphing car metrics into the cloud with Raspberry Pi, OBD and Graphite
19 Apr 2015In this post we’ll see how you can grab car sensors data and turn them into some good loking and easy to watch graphs.
Motivation:
I’ve recently changed my car’s stock air filter with a performance one which really improved the car’s responsiveness. While driving back from Romania to Czech Republic I was thinking that this can’t just come for free and I wanted to see how it impacts the car’s working parameters. First thing I noticed has changed was the fuel consumption. Since the car board computer only provides instantaneous and average fuel consumption numbers I can’t really get to do an analysis of how it changed in time. Numbers are good but, at least for me, it’s hard to interpret them as absolute values and I need to get the whole picture where they stand. The first thought that came to mind was to turn metrics like rpm, speed and instantaneous fuel consumption into easy to read graphs. This would at least get me some more insight with historical data of the car’s working parameters.
So there kicked my doer spirit and I started thinking of ways of doing it. What did I need:
- Data source
I knew most of the cars have a diagnosis port called OBD which is used for reading data from most of the existing sensors in your car.
- Data destination
Once I got all the sensor data I needed to graph it somehow. This would be the easiest task since I had already used Graphite before and knew how easy sending the data and getting the graphs done was.
- Data processor
Now that I have the data source and destination I also needed the device that processes/forwards it. I had a Raspberry Pi standing on my desk for 2 or more years without turning it on so I thought that would be the ideal time to start using it.
- Put everything together
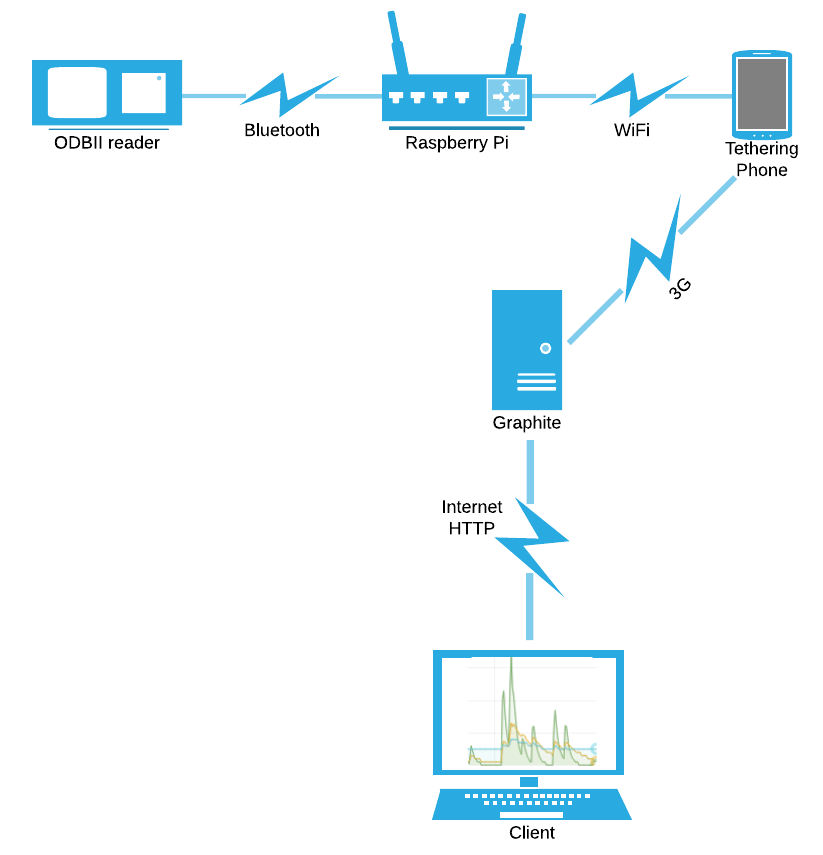
At this point we have the system’s individual components but we need to connect them somehow to get functionality out of it. After doing some searches I found out that there were some cheap Bluetooth OBD readers on the market and decided to go with that. Since I was going to use Bluetooth for connecting the Raspberry Pi to the OBD reader I also needed a USB Bluetooth dongle. The last step in getting the system done would be to get the Raspberry Pi connected to Graphite. Since I’m a cloudy guy I’m going to run Graphite on my Openstack lab so this means I’m going to need an Internet connection on the Pi. First thing that came to mind was getting a USB 3G modem. After doing some reading I found out that most of these modems require external power. I wanted to keep cabling as clean as possible by powering the Pi from the car’s USB port so I went for another approach. The solution I came up was to use my phone’s tethering capabilities and get the Pi connected via WiFi. By doing this I also required a USB WiFi dongle.
Diagram of how this is going to work:
Bill of materials:
- Raspberry Pi Model B
- Kingston 32GB SDHC Memory Card Class 10
- MicroUSB cable
- Asus USB-BT400 Bluetooth dongle
- Edimax EW-7811Un WiFi dongle
- Elm327 OBDII Bluetooth Scanner
- 3G Tethering capable phone
Before getting started:
- Get your Raspberry Pi installed.
- Make sure it’s connected via WiFi to the mobile phone
- Find its IP address and connect to it via SSH
- Install graphite and grafana. You can use these Ansible roles here: https://github.com/remoteur/ansible-graphs
TL;DR. Let’s get started:
- Connect the OBDII reader to your car
- Log in by SSH to the Pi
- Discover the OBDII mac address or read it from the case:
hcitool scan
Scanning ...
00:0D:18:00:00:01 OBDII- Add the MAC address to the Bluetooth conf file.
cat /etc/bluetooth/rfcomm.conf
rfcomm99 {
       bind yes;
       device 00:0D:18:00:00:01;
       channel 1;
       comment "ELM327 based OBD II test tool";
}- Write init script that will manage the Bluetooth connection through the /dev/rfcomm99 device.
cat /etc/init.d/elm327
#!/bin/bash
### BEGIN INIT INFO
# Provides: elm327
# Required-Start:
# Required-Stop:
# Should-Start:
# Should-Stop: $null
# Default-Start: 3 5
# Default-Stop: 0 1 2 6
# Short-Description: Start elm327
# Description: starts the elm327 bluetooth device
### END INIT INFO

DevNum=99       # DevNum is depending on the rfcom settings /etc/bluetooth/rfcom.cfg
case $1 in
start)
     rfcomm bind $DevNum
     ;;
stop)
     rfcomm release $DevNum
     ;;
status)
    rfcomm show $DevNum
    ;;
*)
    cat<<EOF
Usage:
    $0 [ start | stop | status ]

EOF
esac- Create the device by running the init script
sudo /etc/init.d/elm327 start- Install obd python module via pip
sudo pip install obd- Write a script that reads sensor values and sends them to the graphite instance:
import platform
import socket
import time
import obd

CARBON_SERVER = 'graph.remote-lab.net'
CARBON_PORT = 2003
DELAY = 2  # secs


def send_msg(message):
    #    print 'sending message:\n%s' % message
    sock = socket.socket()
    sock.connect((CARBON_SERVER, CARBON_PORT))
    sock.sendall(message)
    sock.close()

def get_rpms():
    cmd = obd.commands.RPM
    response = connection.query(cmd)
    return response.value

def get_speed():
    cmd = obd.commands.SPEED
    response = connection.query(cmd)
    return response.value

if __name__ == '__main__':
    node = platform.node().replace('.', '-')
    connection = obd.OBD("/dev/rfcomm99")
    while True:
        timestamp = int(time.time())
        rpms = get_rpms()
        speed = get_speed()
        lines = [
            'system.%s.rpm %s %d' % (node, rpms, timestamp),
            'system.%s.speed %s %d' % (node, speed, timestamp),
        ]
        message = '\n'.join(lines) + '\n'
        send_msg(message)
time.sleep(DELAY)- Run the script and you should start seeing the metrics graphed by Graphite. I’m using Grafana as a Graphite frontend and here’s how the graphs look like after a ride:
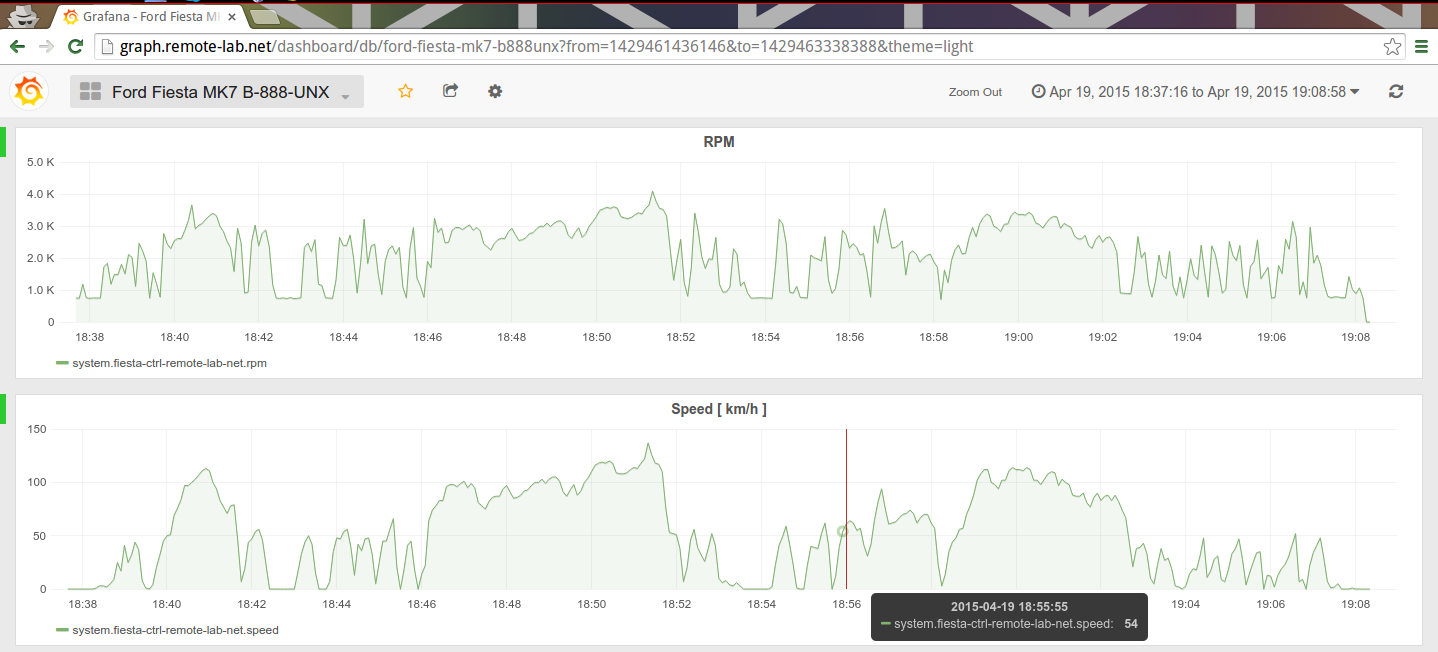
You can see that I only captured the RPM and speed sensor. The equation for calculating the instantaneous fuel consumptions includes a sensor that seems to be missing from my car or at least I don’t know how to read it. I need to dig further to see how I can get it.
I think this is a great example that demonstrates how easily you can leverage a physical measurement by software today. I really like it mostly because I have a general feeling that during our lifetime we could be missing important bits just because we’re not analyzing enough the world around us. As humans we have a limited set of receptors(sensors) and I guess making use of the available compute power on a general scale might at least show us some unknown patterns in the world arounds us.
- Live demo: